
Skip to content
SkimSkim home

Procurement intelligence

Tenders nobody competed for: almost 1 in 3 EU public contracts gets a single bid

We counted the bids on nearly 580,000 advertised public contracts across 31 European countries. In the EU, 30.8% drew exactly one bid, twice the UK rate. €338bn went to the only company that turned up. This report shows where competition is thinnest, and why that is an opening for SMEs.

Skim · Built on Skim's live procurement database24 September 202617 min read

Contract award notices dated 1 January 2023 to 31 December 2025 from TED, Find a Tender and Public Contracts Scotland, held in Skim's procurement database: 579,104 competitive awards with a published bid count across the EU-27, the UK (above threshold), Norway, Switzerland and Iceland. Direct awards are excluded. The trend series covers 2018 to September 2026. Definitions and exclusions are in the methodology section.
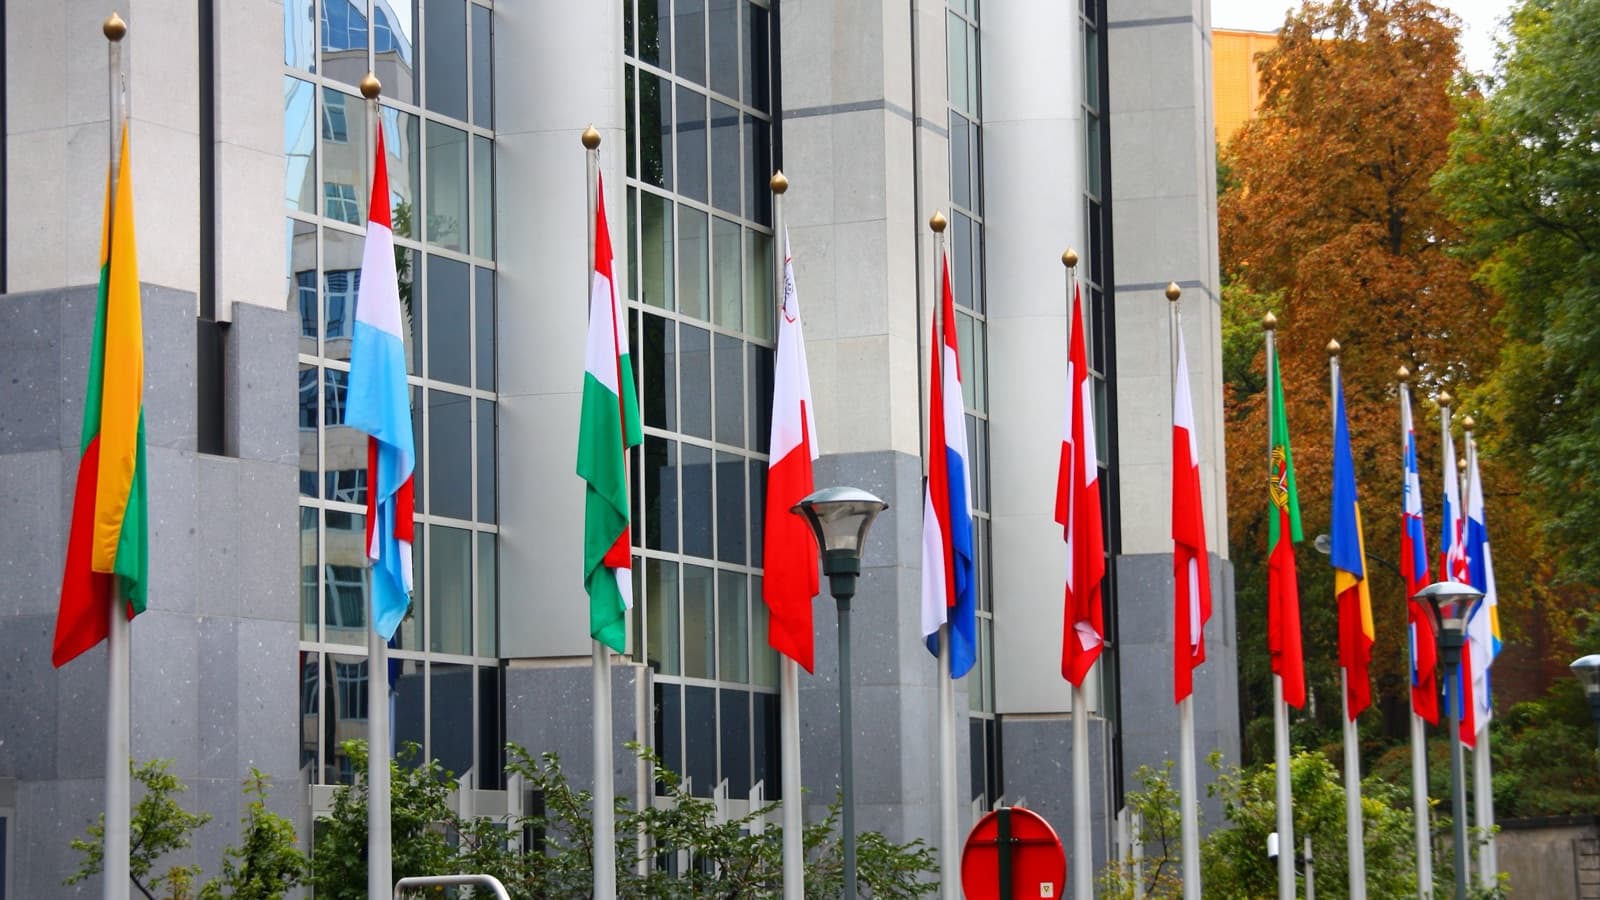
Tenders nobody competed for: almost 1 in 3 EU public contracts gets a single bid — report cover
Photo: Marek Ślusarczyk (Tupungato), CC BY 3.0, cropped

Key findings

  • 30.8% of advertised EU public contracts awarded in 2023–2025 received exactly one bid. In the UK the figure was 15.1%.
  • Half of all competitive EU tenders (51.1%) got two bids or fewer. The median EU contract gets 2 bids; the median UK contract gets 4.
  • About €338bn of EU contracts went to a lone bidder in three years, 23% of all awarded value.
  • Europe splits east and south versus north and west. Greece (54%), Slovenia (50%), Poland (49%) and Czechia (47%) are around three times Germany (18%), Finland (15%) and Switzerland (13%).
  • Competition is thinnest in medical and laboratory equipment (56–59% single-bid) and strongest in construction (11%).
  • Short deadlines drive bidders away. EU tenders open for 15–24 days get a single bid 40% of the time; those open for 60 days or more, 22%.
  • Smaller contracts get fewer bidders. About a third of EU contracts under €1m draw one bid, against about a fifth of those over €25m.
  • Only 2.4% of contract winners in the EU are based in another country. The single market in public procurement is still mostly national.
  • The EU single-bid rate has risen from 26–28% before 2022 to 30–31% since.

One bid in three

We looked at every contract award notice from 2023 to 2025 where the buyer ran an advertised, competitive procedure (open, restricted, competitive dialogue, competitive with negotiation, or the UK's new competitive flexible procedure) and published how many bids it received. Direct awards are excluded. A "single bid" here means the tender was advertised, anyone could bid, and only one company did.
30.8%
Share of advertised EU public contracts awarded in 2023–2025 that received exactly one bid, against 15.1% in the UK

Skim, from 529,768 competitive EU awards with a published bid count

EU-27UK (above threshold)Norway, Switzerland, Iceland
Competitive awards with a published bid count529,76835,21814,118
Share with exactly one bid30.8%15.1%14.1%
Share with two bids or fewer51.1%28.7%34.4%
Median bids per award243
Value awarded to lone bidders~€338bn~€53bn~€8bn
Lone-bidder share of awarded value23.1%8.6%11.7%
Frameworks publish maximum values, which can overstate the money involved. With frameworks and call-offs removed, lone bidders still won €302bn in the EU and €33bn in the UK.
The headline holds when we cut the data differently:
  • Single-lot tenders only: 29.3% EU, 23.4% UK.
  • The typical buyer: the median EU buyer (among those with 20+ awards) sees 25.3% of its contracts get one bid, against 15.3% for the median UK buyer.
  • Buyers where most contracts get one bid: 17.3% of EU buyers (out of 5,639), against 2.9% of UK buyers (out of 272).
The European Commission tracks the same "single bidder" indicator in its Single Market Scoreboard, so these figures can be checked against an official benchmark.

The EU trend is going the wrong way

EU single-bid share, 2018–2026Share of competitive EU contract awards receiving exactly one bid. 2026 runs to September.
15%
20%
25%
30%
35%
27.5%2018: 27.5%
28.6%2019: 28.6%
25.3%2020: 25.3%
26.6%2021: 26.6%
30.9%2022: 30.9%
31.4%2023: 31.4%
31.3%2024: 31.3%
29.7%2025: 29.7%
29.7%2026 YTD: 29.7%
The rate stepped up in 2022 and has not come back down. The data does not show a single cause. One likely factor is that 2022's inflation and energy shock made fixed-price public contracts riskier to bid for, but that is a hypothesis, not a finding.
We do not publish a UK trend. UK data moved from TED to Find a Tender in 2021, and a handful of councils that publish thousands of routine awards can swing a single year's national figure on their own.

A map of Europe: east and south versus north and west

Single-bid share by country, 2023–2025Share of competitive contract awards receiving exactly one bid. UK figures are above-threshold awards only.
GR53.7Greece: 53.7%
SI49.7Slovenia: 49.7%
PL49.0Poland: 49.0%
CZ46.9Czechia: 46.9%
HR42.6Croatia: 42.6%
RO41.3Romania: 41.3%
BG38.2Bulgaria: 38.2%
LT37.6Lithuania: 37.6%
IT32.4Italy: 32.4%
ES32.3Spain: 32.3%
PT30.9Portugal: 30.9%
SK29.4Slovakia: 29.4%
EE27.0Estonia: 27.0%
HU26.3Hungary: 26.3%
AT25.1Austria: 25.1%
CY25.1Cyprus: 25.1%
LV23.8Latvia: 23.8%
BE23.2Belgium: 23.2%
LU21.9Luxembourg: 21.9%
IE21.4Ireland: 21.4%
MT20.1Malta: 20.1%
DK20.1Denmark: 20.1%
SE20.0Sweden: 20.0%
FR19.8France: 19.8%
NL18.7Netherlands: 18.7%
DE18.0Germany: 18.0%
IS17.8Iceland: 17.8%
NO16.5Norway: 16.5%
UK15.1UK: 15.1%
FI14.6Finland: 14.6%
CH13.1Switzerland: 13.1%
  • 45% or more
  • 35–45%
  • 25–35%
  • 20–25%
  • 15–20%
  • Under 15%
Show the data
CountryAwardsOne bidMedian bidsValue to lone bidders (€bn)
Greece6,51453.7%111.0
Slovenia6,92849.7%25.0
Poland80,16149.0%261.3
Czechia26,37546.9%214.1
Croatia7,65442.6%24.2
Romania26,06141.3%231.1
Bulgaria19,77138.2%24.3
Lithuania10,05137.6%22.1
Italy22,46132.4%248.7
Spain53,30332.3%232.1
Portugal8,28130.9%39.8
Slovakia5,79629.4%24.5
Estonia4,54727.0%32.5
Hungary8,14226.3%28.0
Austria5,22225.1%37.0
Cyprus1,00325.1%20.2
Latvia8,84923.8%31.6
Belgium7,28723.2%35.4
Luxembourg1,25421.9%31.2
Ireland4,77621.4%33.1
Malta1,05320.1%30.2
Denmark3,63920.1%34.7
Sweden12,21920.0%33.4
France72,49319.8%349.6
Netherlands14,01318.7%36.5
Germany106,71618.0%414.9
Iceland32017.8%30.0
Norway3,42916.5%32.8
UK (above threshold)35,21815.1%453.1
Finland5,19914.6%31.4
Switzerland10,25813.1%45.0
Greece is the only country where the median advertised contract gets a single bid. Poland is the largest single-bid market by far: 80,000 competitive awards, half of them with one bidder, and €61bn awarded to lone bidders. The UK sits with the Nordics and Switzerland, among the most competitive markets in Europe.
France, the EU's second-largest market by award count, sits at 19.8%. Its thinnest sectors are insurance (37.8%), laboratory equipment (37.1%) and transport services (36.7%). Architecture and engineering is the most contested, at 9.2%. Among large French cities and their agencies, the rate ranges from 26% (Metz Métropole) to 12% (Paris Habitat).

Where competition is thinnest: by sector

EU single-bid share by sector, 2023–2025Share of competitive awards receiving exactly one bid, by CPV division.
  • Laboratory, optical & precision equipment
    58.8%
  • Medical equipment & pharmaceuticals
    56.0%
  • Health & social work services
    44.1%
  • Transport equipment
    42.8%
  • Repair & maintenance
    42.0%
  • Software packages
    40.6%
  • Security & defence equipment
    38.5%
  • IT services
    37.7%
  • Financial & insurance services
    35.5%
  • Waste, cleaning & environmental
    25.7%
  • Business services (legal, consulting, recruitment)
    18.4%
  • Architecture & engineering
    15.5%
  • Construction works
    10.7%
Show the data
Sector (CPV division)AwardsOne bidMedian bids
Laboratory, optical & precision equipment11,73758.8%1
Medical equipment & pharmaceuticals61,48456.0%1
Health & social work services7,92144.1%2
Transport equipment28,02242.8%2
Repair & maintenance21,63642.0%2
Software packages11,70540.6%2
Security & defence equipment3,41938.5%2
IT services18,92737.7%2
Financial & insurance services11,91735.5%2
Waste, cleaning & environmental33,84325.7%3
Business services (legal, consulting, recruitment)24,17818.4%3
Architecture & engineering46,33915.5%4
Construction works79,81710.7%4
By contract type, 41% of EU goods contracts get one bid, against 28% of services and 10% of works.
The medical figure has a mundane explanation. The EU buyers where most contracts get a single bid are almost all hospitals, mainly in Poland, plus Motol in Prague and La Paz in Madrid. They buy drugs and devices in single-product lots, and where a product is patented only one supplier can bid. That is a structural feature of how medicines are bought, not evidence of wrongdoing.
The more telling numbers are further down the table. Four in ten EU contracts for repair and maintenance, software and transport equipment draw a single bid, and so do 38% of IT services contracts. These are markets full of capable suppliers, many of them SMEs, and the tenders are still going uncontested.
UK single-bid share by sector, above threshold, 2023–2025Share of competitive awards receiving exactly one bid, by CPV division.
  • Laboratory & precision equipment
    32.1%
  • Health & social work
    24.2%
  • Administration, defence & social security
    22.8%
  • Education & training
    21.9%
  • Financial & insurance services
    21.1%
  • Transport equipment
    18.6%
  • R&D
    18.5%
  • Repair & maintenance
    15.7%
  • Medical equipment & pharmaceuticals
    15.6%
  • IT services
    13.5%
  • Business services
    12.1%
  • Software packages
    10.9%
  • Waste, cleaning & environmental
    9.5%
  • Construction works
    9.3%
  • Architecture & engineering
    8.6%
  • Transport services
    6.9%
Show the data
Sector (CPV division)AwardsOne bid
Laboratory & precision equipment48932.1%
Health & social work8,08024.2%
Administration, defence & social security38122.8%
Education & training97821.9%
Financial & insurance services59621.1%
Transport equipment78718.6%
R&D37818.5%
Repair & maintenance1,11615.7%
Medical equipment & pharmaceuticals86015.6%
IT services83213.5%
Business services2,03612.1%
Software packages71510.9%
Waste, cleaning & environmental1,3139.5%
Construction works2,1929.3%
Architecture & engineering1,3968.6%
Transport services6,7656.9%
Health and social care is the UK's biggest uncontested category: 8,080 awards, nearly a quarter with one bidder, mostly care placements and community services. At the other end, UK transport services contracts get a median of 10 bids each.

Small contracts and short deadlines

Single-bid share by contract size, 2023–2025Awarded contract value.
EU one bidUK one bid
  • Under €500k
    ~34%
    15.5%
  • €500k–1m
    34.5%
    17.2%
  • €1m–5m
    31.6%
    15.8%
  • €5m–25m
    22.5%
    14.5%
  • €25m–100m
    21.1%
    11.2%
  • €100m+
    20.7%
    8.4%
Large contracts attract the big bid teams. Contracts under €1m are where a third of EU tenders go uncontested, and those are exactly the contracts SMEs are built to win.
EU single-bid share by tender window, 2023–2025Days from publication to the bid deadline.
  • Under 15 days
    38.0%
  • 15–24 days
    40.1%
  • 25–29 days
    29.7%
  • 30–34 days
    31.7%
  • 35–44 days
    31.8%
  • 45–59 days
    24.0%
  • 60+ days
    21.9%
Show the data
WindowAwardsOne bid
Under 15 days4,71438.0%
15–24 days17,24840.1%
25–29 days36,86829.7%
30–34 days143,00231.7%
35–44 days117,54631.8%
45–59 days32,91824.0%
60+ days17,13021.9%
EU tenders open for less than 25 days are nearly twice as likely to get a single bid as those open for 60 days or more. The UK shows the same effect, less sharply: 18.2% for windows under 25 days, 12.2% for 45 days or more. A short window favours whoever already knew the tender was coming.

Only 2.4% of winners cross a border

The single market was meant to open public procurement to bidders from across Europe. In practice, only 2.4% of winning suppliers on EU contracts are based in a different country from the buyer, and only 1.9% come from another EU member state. UK buyers show the same 2.4%.
2.4%
Share of winning suppliers on EU contracts based in a different country from the buyer

Skim, from a 3% random sample of 54,264 winning-supplier records

Share of winning suppliers based in another countryThe three most open and five most closed EU markets.
  • Belgium
    16.8%
  • Ireland
    13.1%
  • Austria
    9.8%
  • Poland
    1.3%
  • France
    1.0%
  • Hungary
    1.0%
  • Romania
    0.6%
  • Bulgaria
    0.4%
The most open markets are small countries next to large ones. The most frequent foreign winners in the EU are German, British, Dutch and French companies. For UK buyers they are American, German and Irish.
This counts direct cross-border wins only. A French subsidiary of a German group counts as French, so the real reach of foreign groups is higher. Even so, a company registered outside the buyer's country rarely wins directly.

The UK picture

The UK's lower single-bid rate has a few visible drivers.
  • Frameworks. Across all UK awards, 11.7% of frameworks got one bid, against 22.7% of other contracts. In the EU the gap is small (27.2% vs 31.0%).
  • Early signs from the Procurement Act. Since 24 February 2025, above-threshold procedures run under the new Act have had a 10.4% single-bid rate, against 14.8% for legacy procedures still finishing. The competitive flexible procedure comes in at 8–10%. This is not a like-for-like comparison, because Act procurements are newer and smaller on average, so treat it as an early signal, not a result.
  • Big uncontested contracts still happen. Among the largest UK awards in 2025 that drew a single bid, several are council waste and street-cleaning contracts. These are long, asset-heavy services where the incumbent owns the depots and vehicles and a new entrant has to finance all of that before the first bin is collected.
Single-bid share: frameworks against other contractsShare of all awards receiving exactly one bid.
FrameworksOther contracts
  • UK
    11.7%
    22.7%
  • EU
    27.2%
    31.0%
The largest single-bid awards of 2025
BuyerContractWinnerValue
LB Barking and DagenhamResidual wasteCory£1.29bn
Ministry of DefenceIn-port marine servicesSerco£829m
South Oxfordshire DCWaste collection & street cleaningBiffa£276m
LB MertonWaste & recycling collectionVeolia£205m
RB KingstonHousehold waste, recycling & street cleansingVeolia£187m
NHS England LondonBreast screening programmeKing's College Hospital£168m
Rennes Métropole (FR)Mobility public service concessionKeolis€1.33bn
Santa Casa da Misericórdia de Lisboa (PT)HR outsourcingMEO€1.45bn
CNAIR (RO)Târgu Mureș–Târgu Neamț motorway, section IIEuro-Asfalt~€1.2bn
PKP Intercity (PL)Traction electricity supplyPGE Energetyka Kolejowa~€1.2bn
Bid counts are as reported by the buyer on the award notice. For multi-lot tenders they refer to the first lot.
A separate question is how many UK contracts are never advertised at all. That is the subject of our next report.

What a single bid does and doesn't mean

A single bid is not evidence of corruption. Patents, niche equipment, specialist care and incumbents who own the assets all produce one-bidder markets for legitimate reasons. It is still a signal. A contract with one bidder means the buyer had nothing to compare the offer against, and it may mean capable suppliers never saw the tender, saw it too late, or decided they could not win.
For suppliers, that last group is the opportunity.

“Every uncontested tender is one where a credible second bid would have been in a two-horse race.”

Four moves for suppliers

1. Look where competition is thin. The data points to specific markets: repair and maintenance, software, IT services and transport equipment across the EU, and health, education and financial services in the UK. It also points to contracts under €1m and, if you can operate there, the south and east of Europe. Filter your pipeline by where you are likely to face one or two rivals, not by where the headlines are.
2. Be ready for short deadlines. A 20-day window doubles the chance that nobody else bids. The suppliers who win those tenders saw them coming. Track contract expiry dates and buyer pipelines so the notice is a confirmation, not a surprise, and keep standard response material ready to reuse.
3. Talk to buyers who keep getting one bid. A buyer whose tenders routinely draw a single response has a problem it wants solved. Use pre-market engagement to introduce yourself before the next one is published. Being the second credible bidder makes you welcome.
4. Consider crossing a border, with care. With only 2.4% of winners based abroad, the barriers are real: language, local registration and references. The most open markets (Belgium, Ireland, Austria) are the practical place to start, often through a local partner or joint bid.

FAQ

What share of EU public contracts get a single bid?
30.8% of advertised, competitive EU public contracts awarded in 2023–2025 received exactly one bid, based on 529,768 awards with a published bid count. About €338bn, 23% of awarded value, went to a lone bidder.
How does the UK compare with the EU on single bidding?
The UK rate is about half the EU's: 15.1% of above-threshold competitive awards drew one bid, and the median UK contract gets 4 bids against 2 in the EU. The UK sits with the Nordics and Switzerland among the most competitive markets in Europe.
Which EU countries have the highest single-bid rates?
Greece (53.7%), Slovenia (49.7%), Poland (49.0%) and Czechia (46.9%). Switzerland (13.1%), Finland (14.6%) and the UK (15.1%) have the lowest.
Does a short tender deadline mean fewer bidders?
Yes. EU tenders open for 15–24 days get a single bid 40.1% of the time, against 21.9% for those open 60 days or more. The UK shows the same pattern, less sharply.

Methodology

Source. Skim's procurement database, built from TED (EU, EEA, Switzerland, and the UK before 2021), Find a Tender (UK) and Public Contracts Scotland. It covers contract award notices dated 1 January 2023 to 31 December 2025; the trend series covers 2018 to September 2026.
Bid count. The "number of tenders received" as published by the buyer. Values of zero, negative values or values above 1,000 are excluded. About 10% of TED awards publish no count and are left out.
Competitive procedures. Open, restricted, competitive dialogue, competitive with negotiation and competitive flexible procedures. Direct awards and negotiated procedures without prior publication are excluded.
UK figures. Above-threshold awards only. Below-threshold notices on Find a Tender are excluded, as are Public Contracts Scotland notices with no legal basis, many of which are framework call-offs. Duplicate UK records across sources are removed.
Values. The awarded value as published, converted to euros. Frameworks publish maximum values, so totals are also shown without frameworks. Records above €2bn or below €100 are excluded as implausible.
Multi-lot tenders. One bid count is recorded per procedure, taken from the first lot. Single-lot tenders alone give a 29.3% EU rate.
Cross-border. Based on a 3% random sample of winning-supplier records (54,264 records). "Foreign" means the supplier's registered address is in a different country from the buyer's.
See our full methodology.
Put the data to work. Find the contracts, buyers and incumbents in your market, then decide where to bid. Try Skim for free

Download the full report

Submit the form below to access the full report.

Want this analysis run on your own pipeline?

Start for free and run your real opportunities through Skim — see what the data says about your win chances.